Grocery Signery
A data visualization and story exploration of New York City grocery store signs, revealing how everyday storefronts reflect cultural identity and neighborhood diversity.
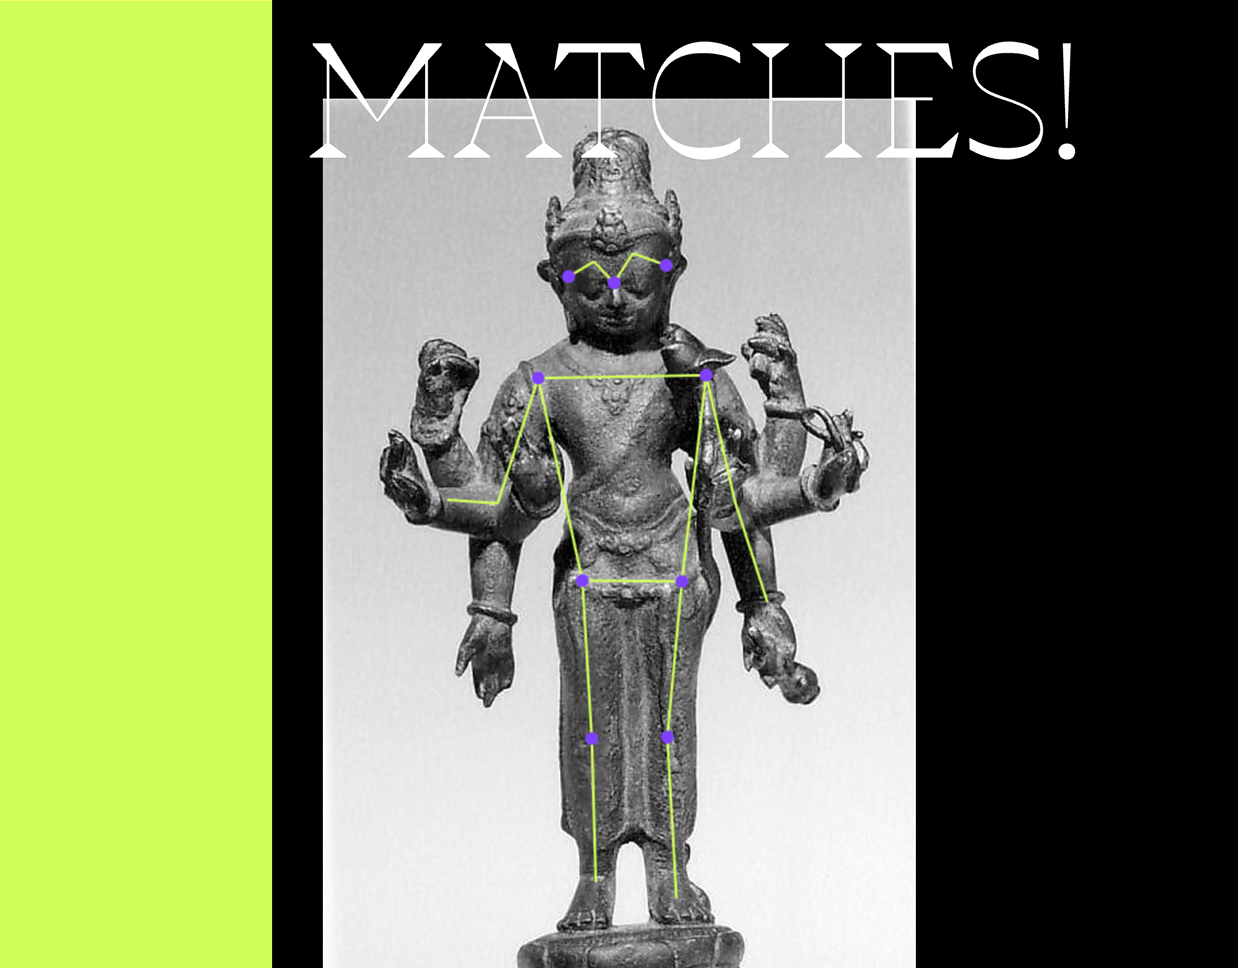
Living Sculpture
An interactive experience where users upload or capture images, then match their poses to the postures of Buddhist sculptures using machine learning.

MTA: Moving Tiles Art in Subway
An interactive visual pattern generated from real-time MTA subway data, inspired by mosaic tile art found on subway walls.

Anxiety Storage
A static data visualization based on personal anxiety tracking, evolving from hand-drawn postcard to a digitally refined design.

The Greeting Cards Unfolded
A data story visualizing the Cooper Hewitt, Smithsonian Design Museum's greeting card collection, highlighting design elements, colors, and occasions that make these cards memorable.
Framing Gender
A data visualization analyzing the careers of sitters in the Smithsonian National Portrait Gallery, highlighting gender representation and trends over time.
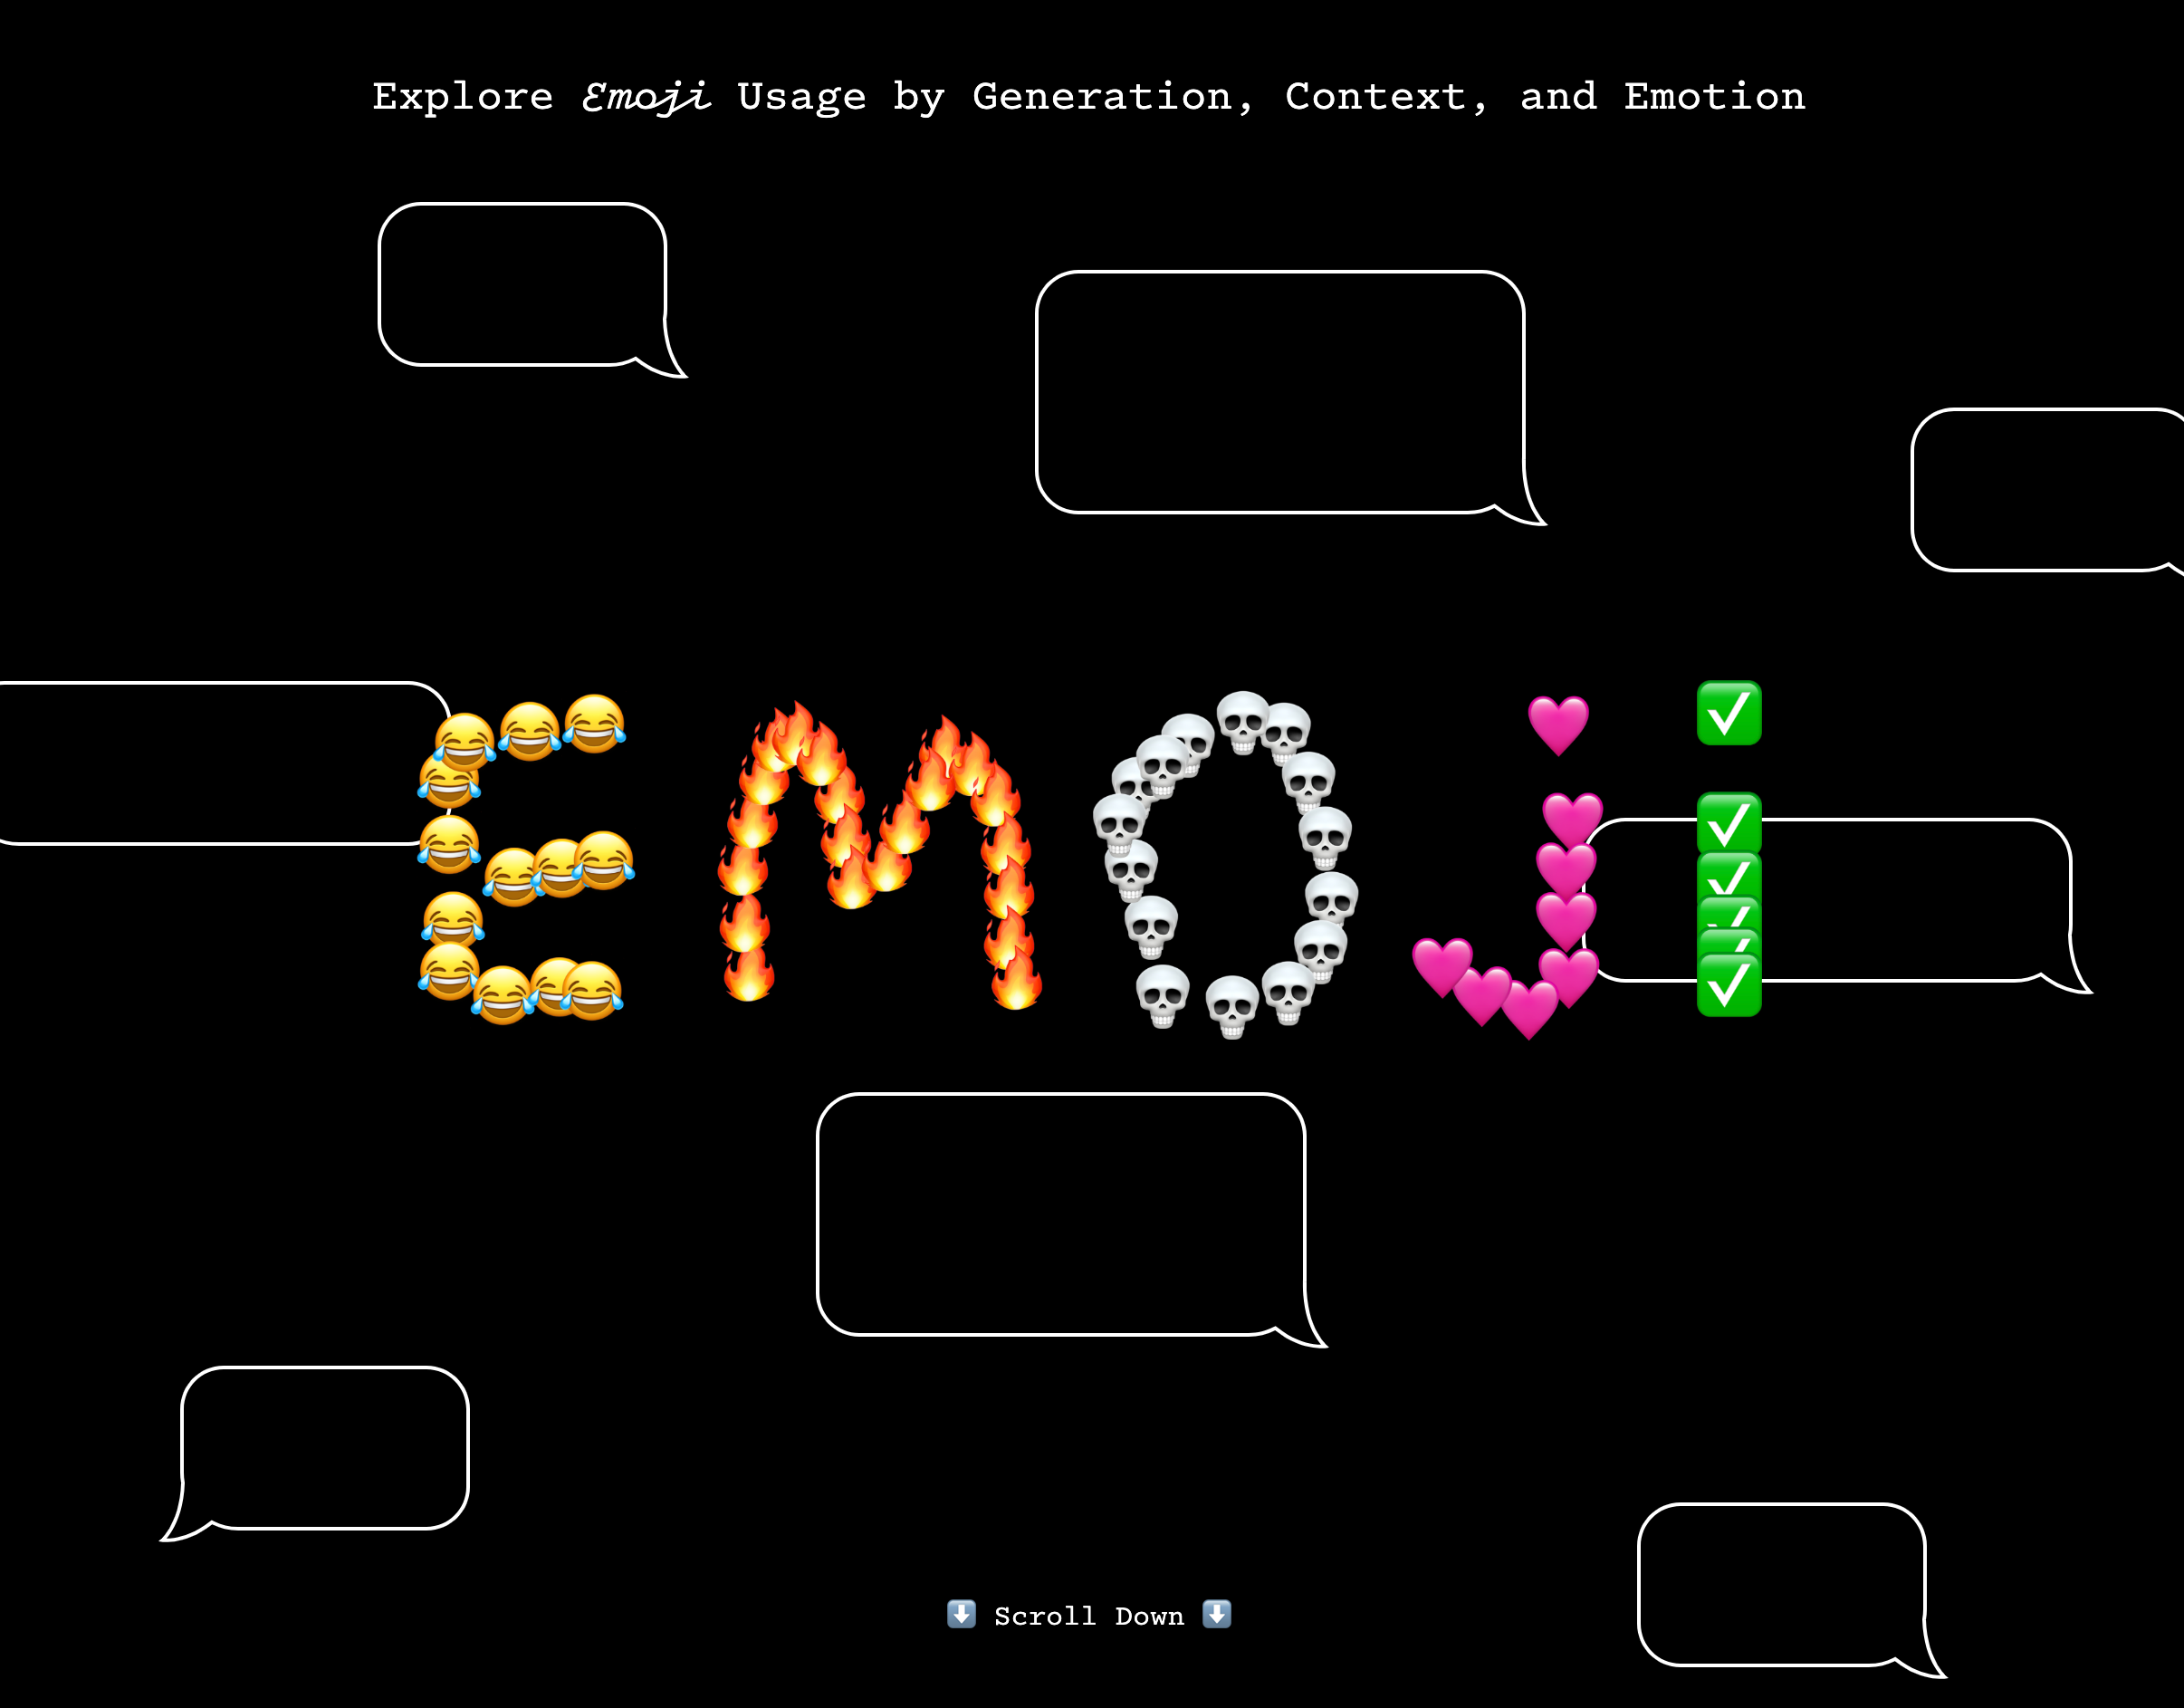
Emoji in Context
A data visualization analyzing emoji usage across generations, contexts, and emotional expressions.
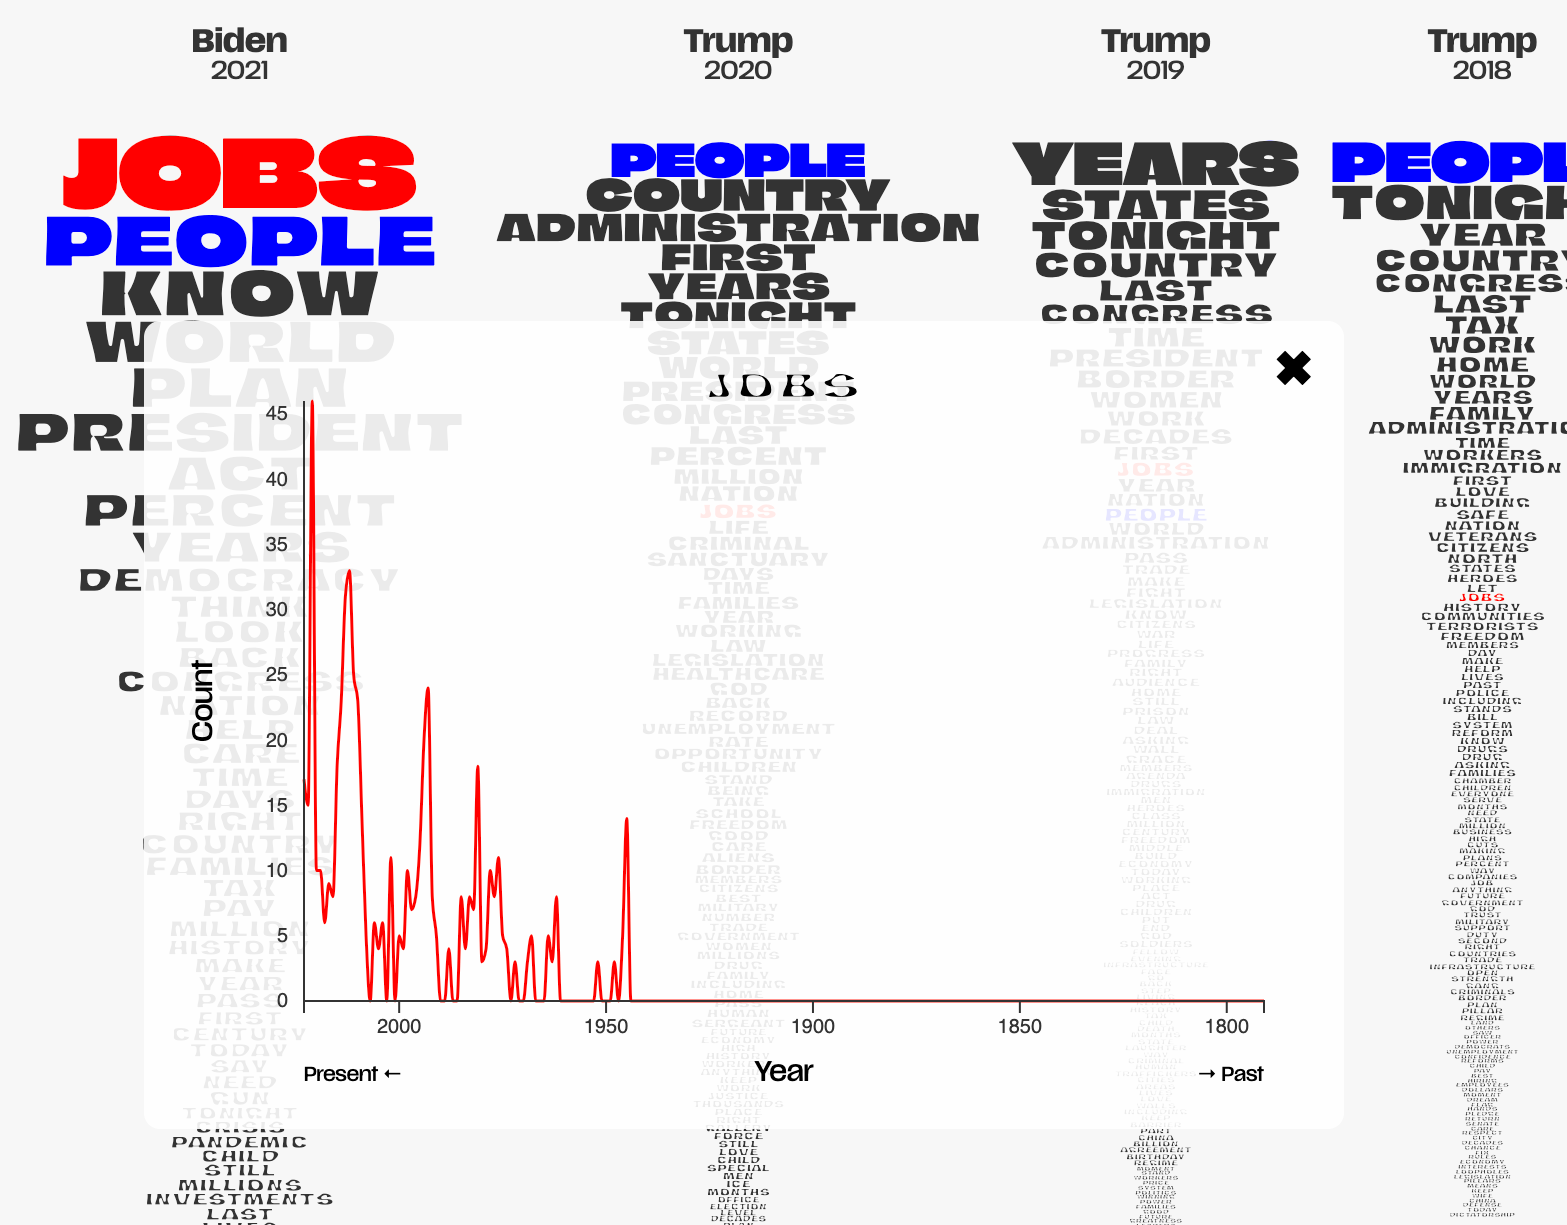
From Noun to Nation
A data visualization analyzing words in State of the Union addresses and exploring the most frequently used nouns from the present (2023) to the past (1790)
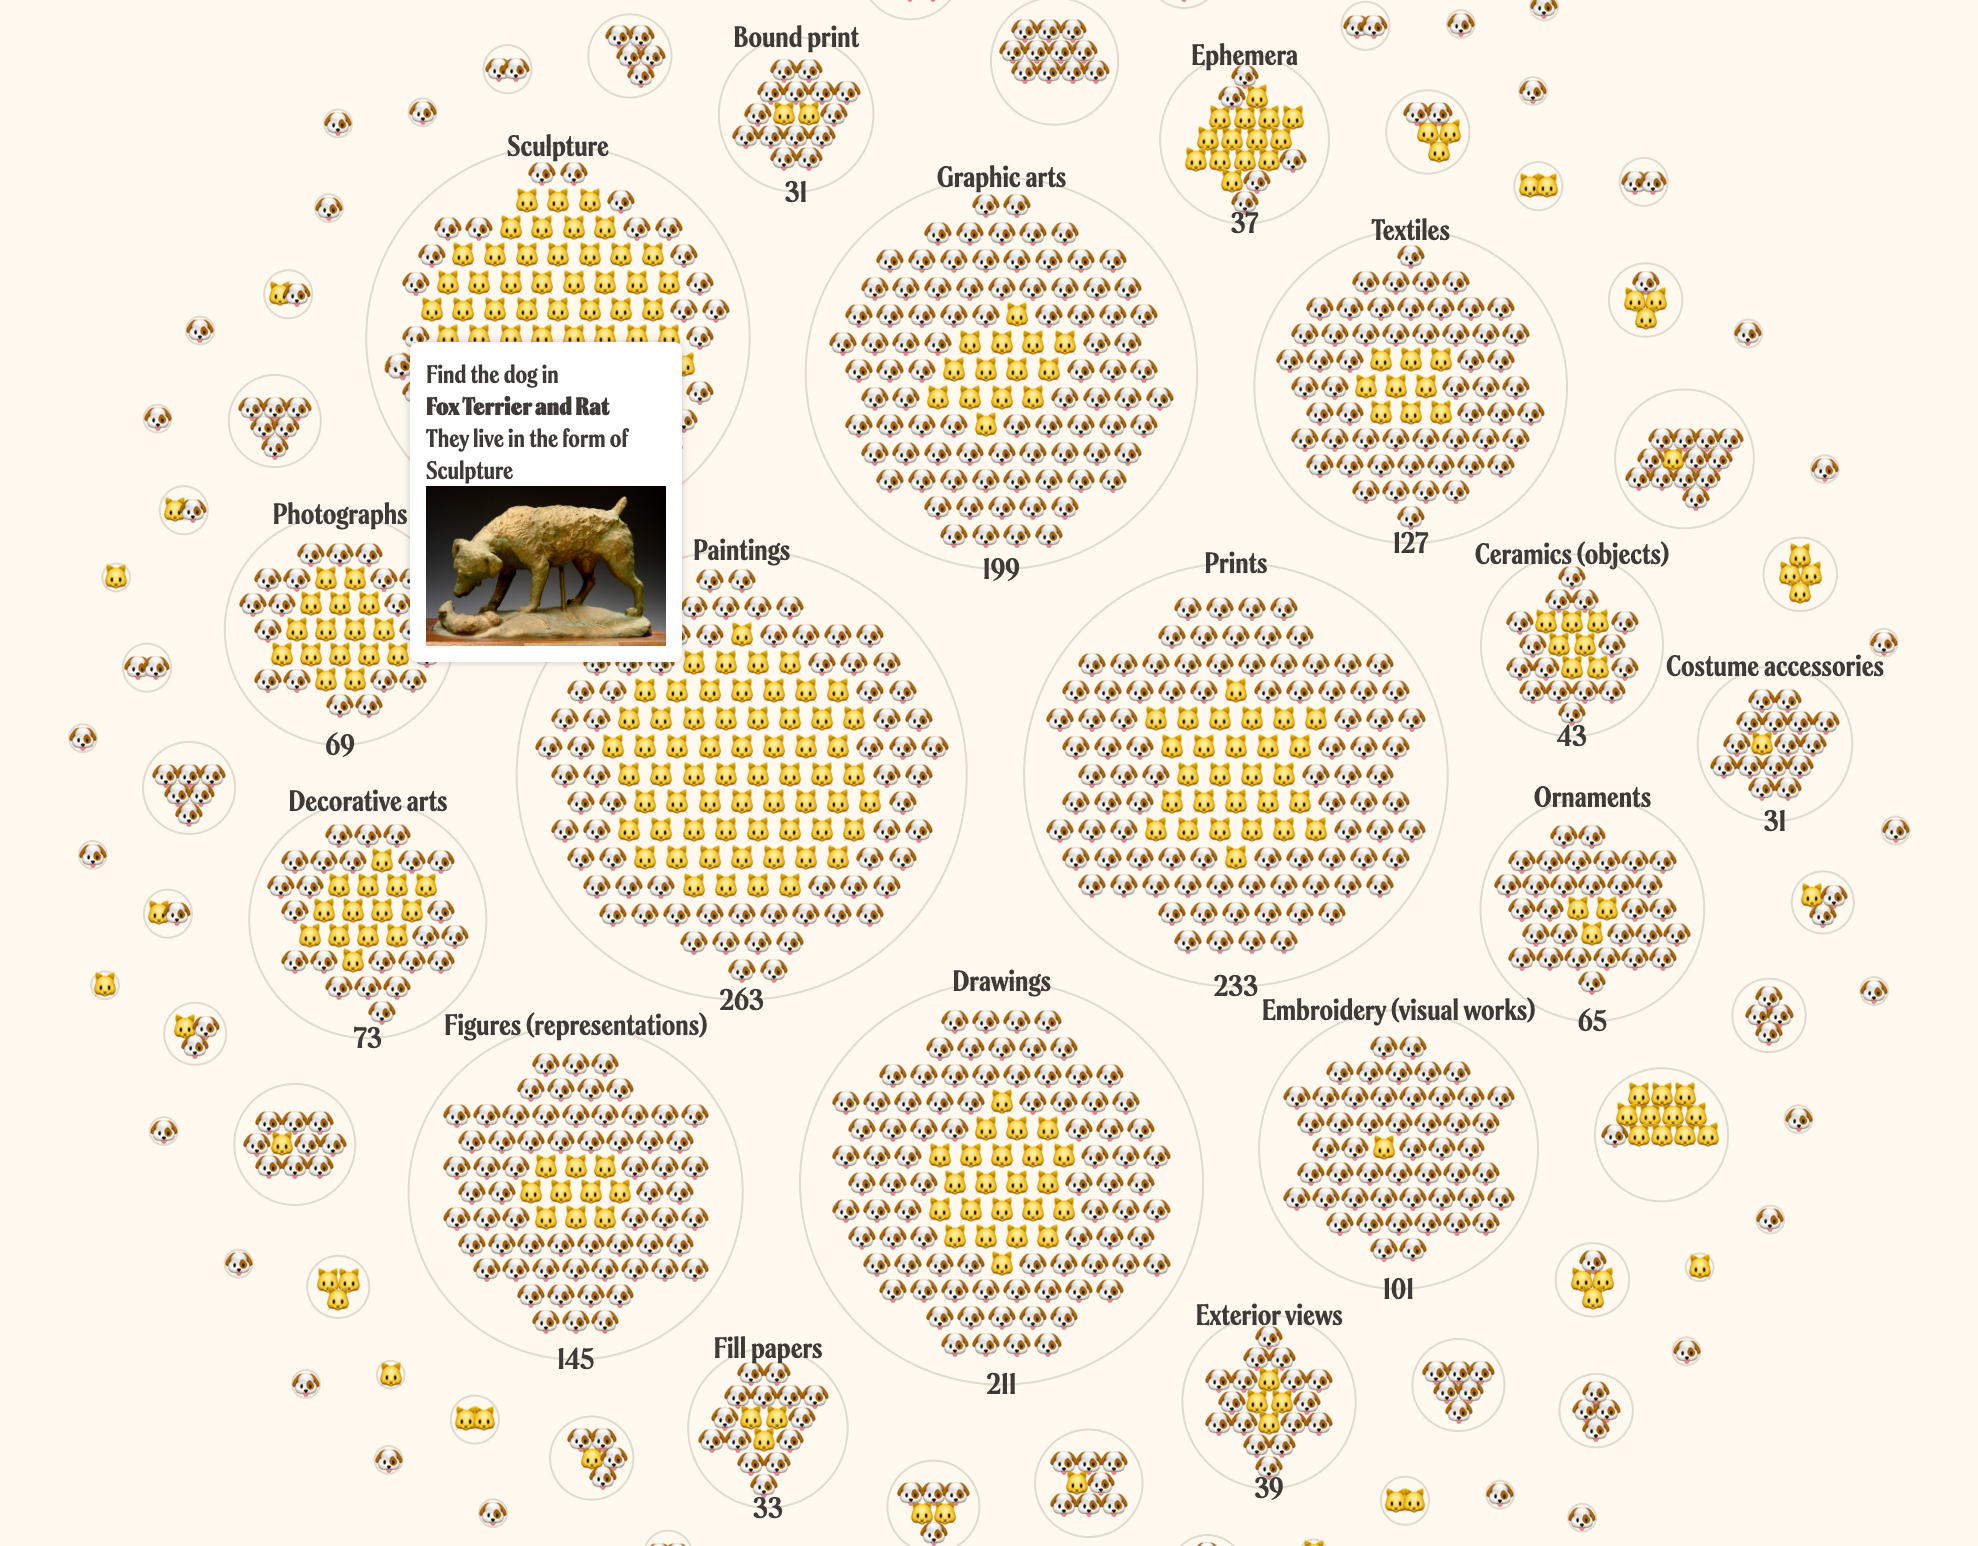
Cats and Dogs in Museums
A data visualization examining the keywords "Cat" and "Dog" in the art and design collections of Smithsonian museums.

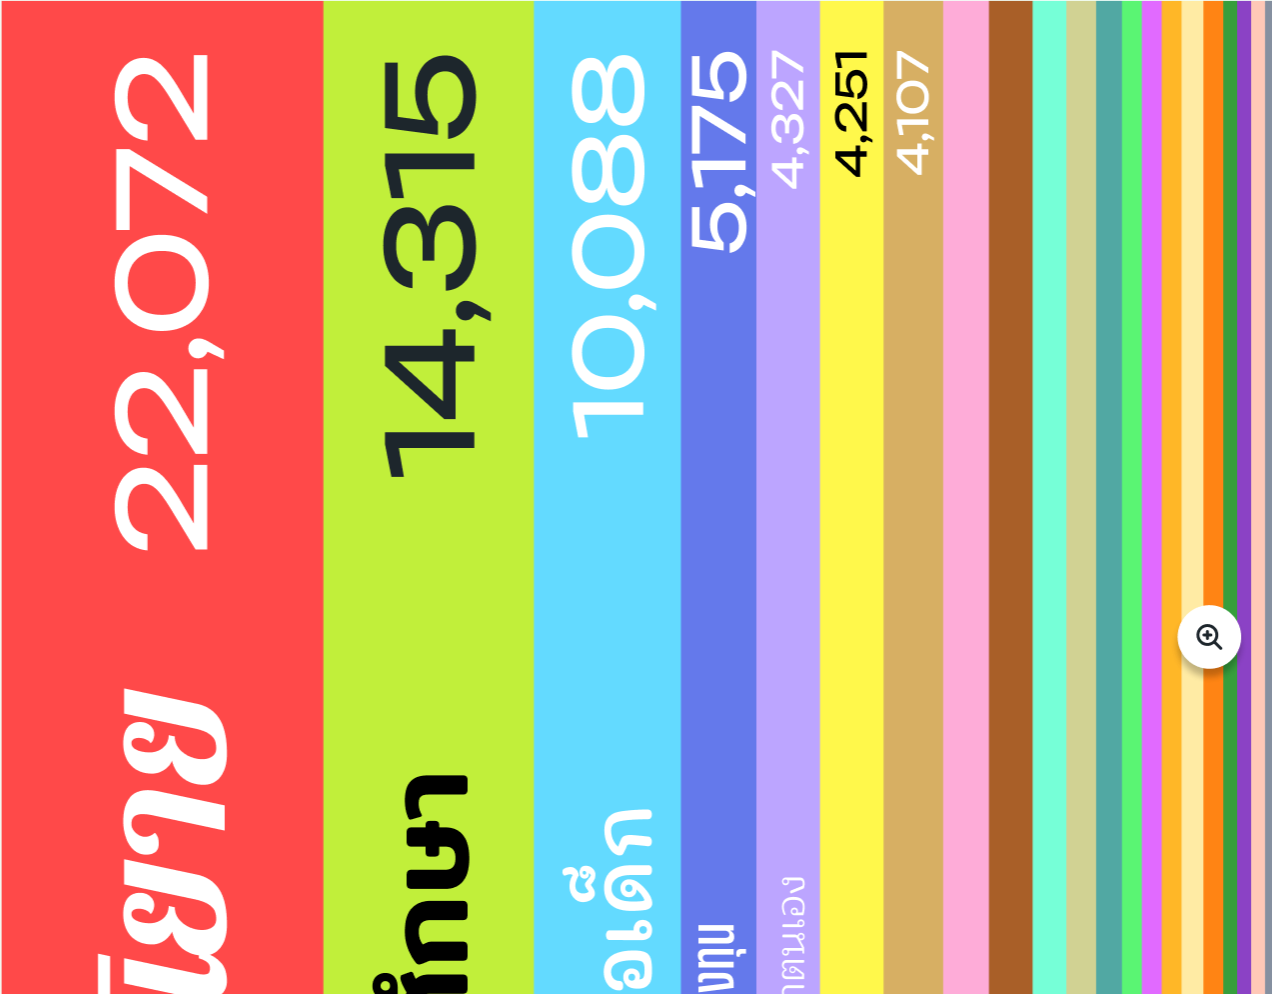
Fill Right Gaps
A text-based data visualization and tool that uncovers Thailand’s rights gaps and reveals new ideas from around the world.
Look around the shelf
A data story of Thai books about diversity, prices, and publishers.
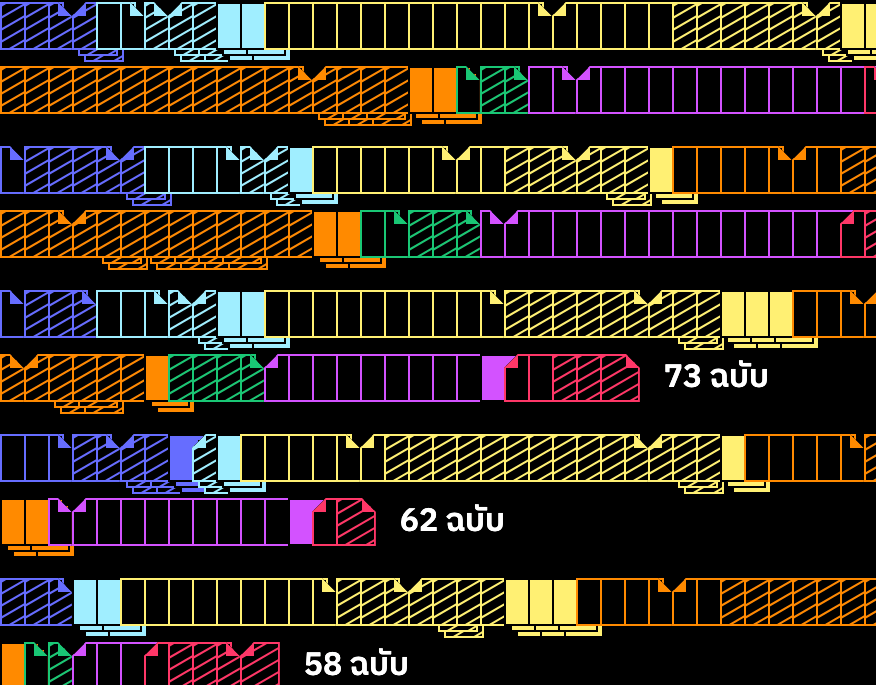
Law Watch
A data visualization of proposed laws in Prayuth's second government: MPs' actions on Thai legal Matters After Coup Phase.


Studio Anniversary
A microsite and data visualization showcasing all projects created for the 4th anniversary of Punch Up and Wevis studio.
Better road, Better life
A data story reveals insights about road safety issues. Beyond driving carefully, we could improve our 'road safety system' to have a better life.

Politics & Business
A data visualization of relationship between politicians and business
Zocial Eyes
The Infographic posters use the 'Zocial Eye' social listening tool, focusing on current Social trends identified via relevant hashtags.
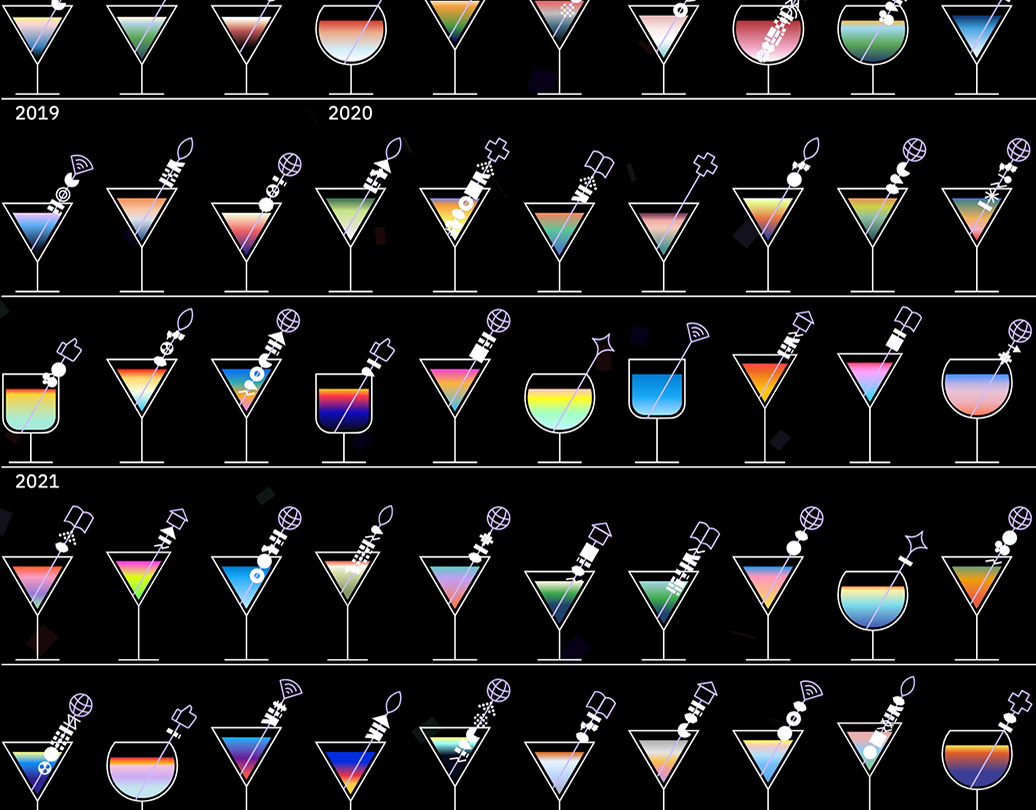
Studio Project Reviews
A data visualization to celebrate the 3 years of our studio, Punch Up & Wevis, visualizing cocktails from the projects

Tracking forced labour in SEA
A data story of forced labour in SEA: locations, stakeholders, and accountability from Real Cases
Initiative Law
A data visualization of people's initiative laws in Thailand through the last 20 years, where it started, where it stuck, and how it ended

Mental well-being of Thai public sector official
A data story of the mental well-being of more than thousands of Thai public sector officials.
NCDs Thai health
A data story of the threads of non-communicable diseases (NCDs) that drain our lifespan to promote Thai Health
Child Welfare
A data story of the problem of “child welfare” inequality in Thailand, and the “Child Support Grant” policy.

Cloud Classroom
A data story of online learning problems that Thai students have faced during the COVID-19 pandemic and questions about government’s actions.
Intergenerational Privilege
A data story of intergenerational privileges in Thailand, and finding the solution with equity-based education from equitable education fund.
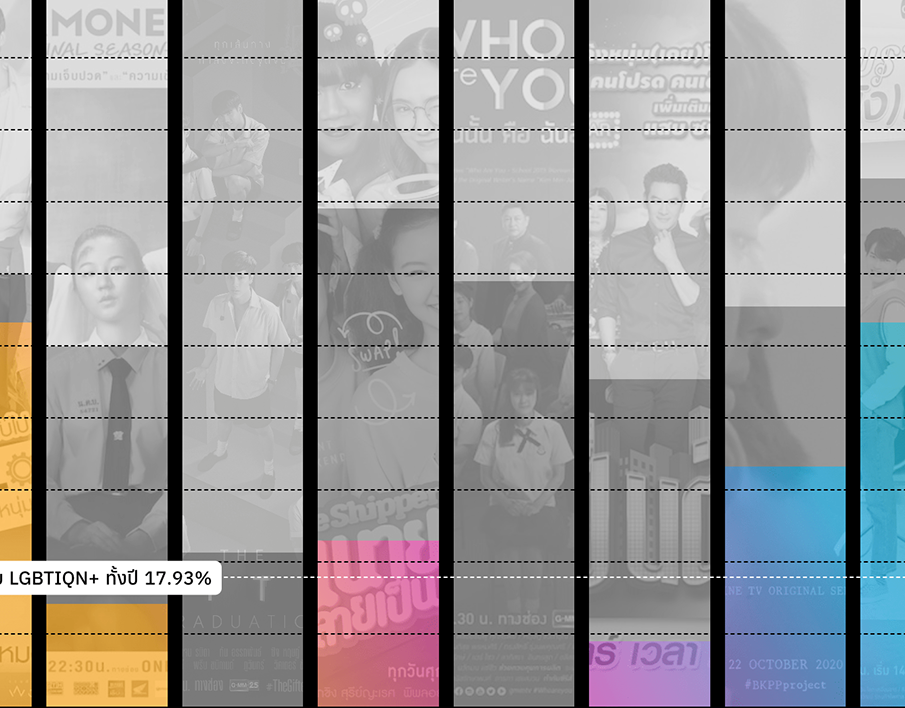
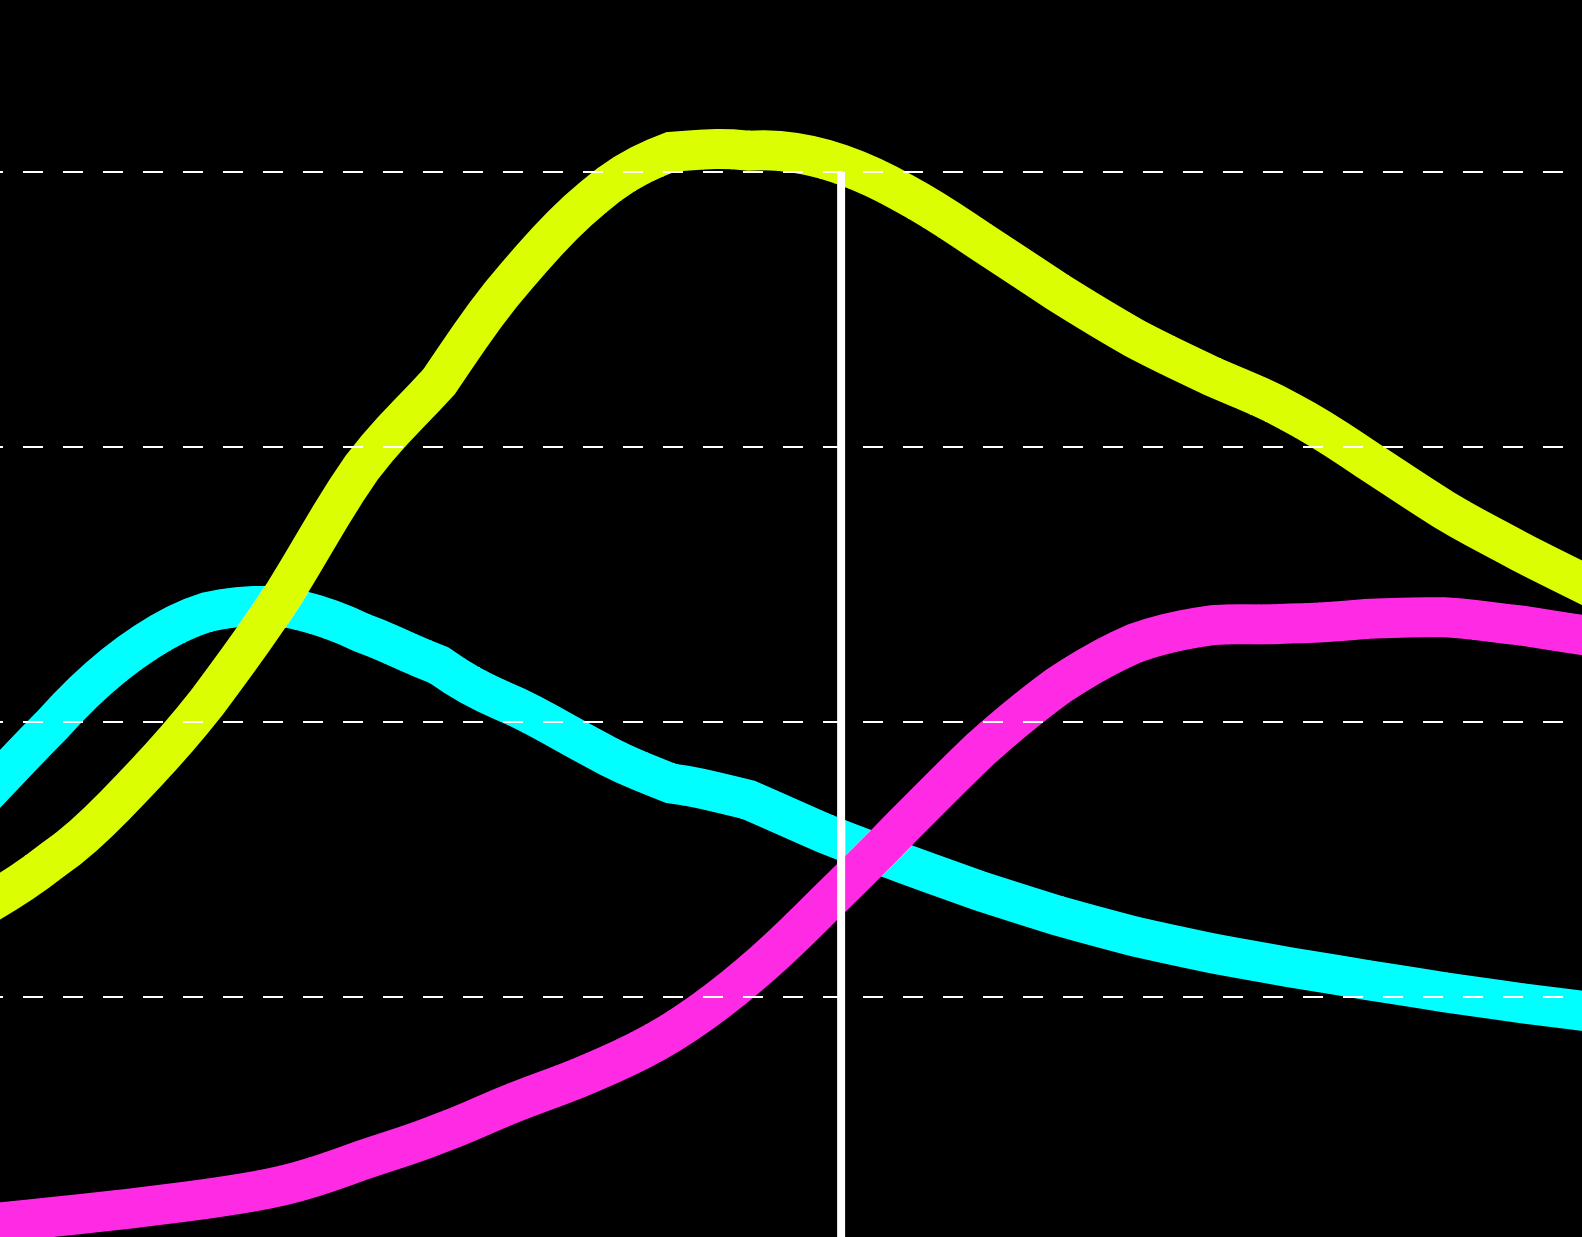
Gender on Screen
A data story exploring the meaning of gender through the world of entertainment industry, the problem of diversity on screen and behind the scene.

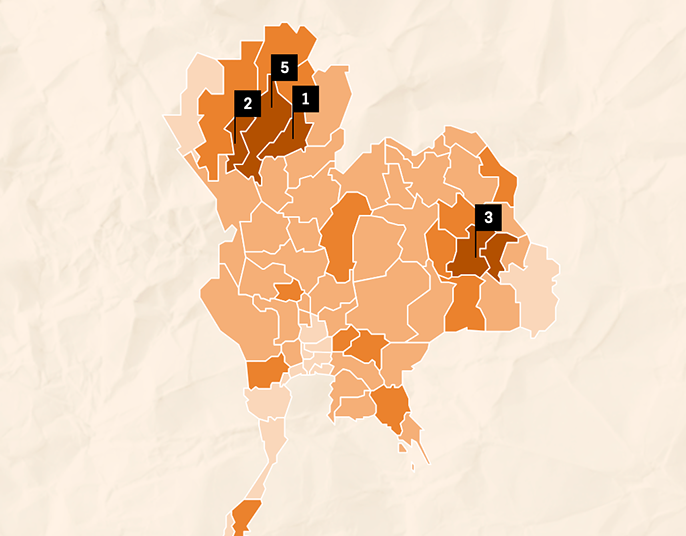
Food trend & culture
A data story about food trends and culture in Bangkok: popular dishes, popular places, and some side stories.

Once we voted YES
A survey data of those who supported a referendum on the current constitution but changed their minds turned into a data story.
Editorial Graphics, Illustration and Motion Design
The Graphics and illustration works for news media; OnUFO and TheMatter during 2020