This project aims to highlight inequality in the entertainment industry by gathering data from over a thousand movies, series, and dramas in Thailand and internationally. While there have been some improvements in recent years, the data still shows that women and LGBTQN+ individuals have fewer roles compared to men in this industry. This issue requires increased social awareness and action to drive meaningful change in the future.
As a digital designer at Punch Up, a data storytelling studio, this is my first project. I developed the design based on the art direction by Namsai Supavong, incorporating a bright and colorful rainbow theme to reflect LGBTQN+ colors. I also included collages of people from movie posters. To create the charts, I manually designed playful visuals using Google Sheets and Adobe Illustrator. Some of the gimmicks in the charts might be too playful for users and developers to manage, such as bar charts with rainbow gradient posters. It was a valuable lesson for me to balance visual appeal and clarity.
After launching the project on June 1, 2021, to celebrate Pride Month, it received attention on the real screen on the ThaiPBS channel and sparked discussions with experts in this field. This is a significant step in raising awareness about this issue beyond the screen, and I am proud to be part of this project.

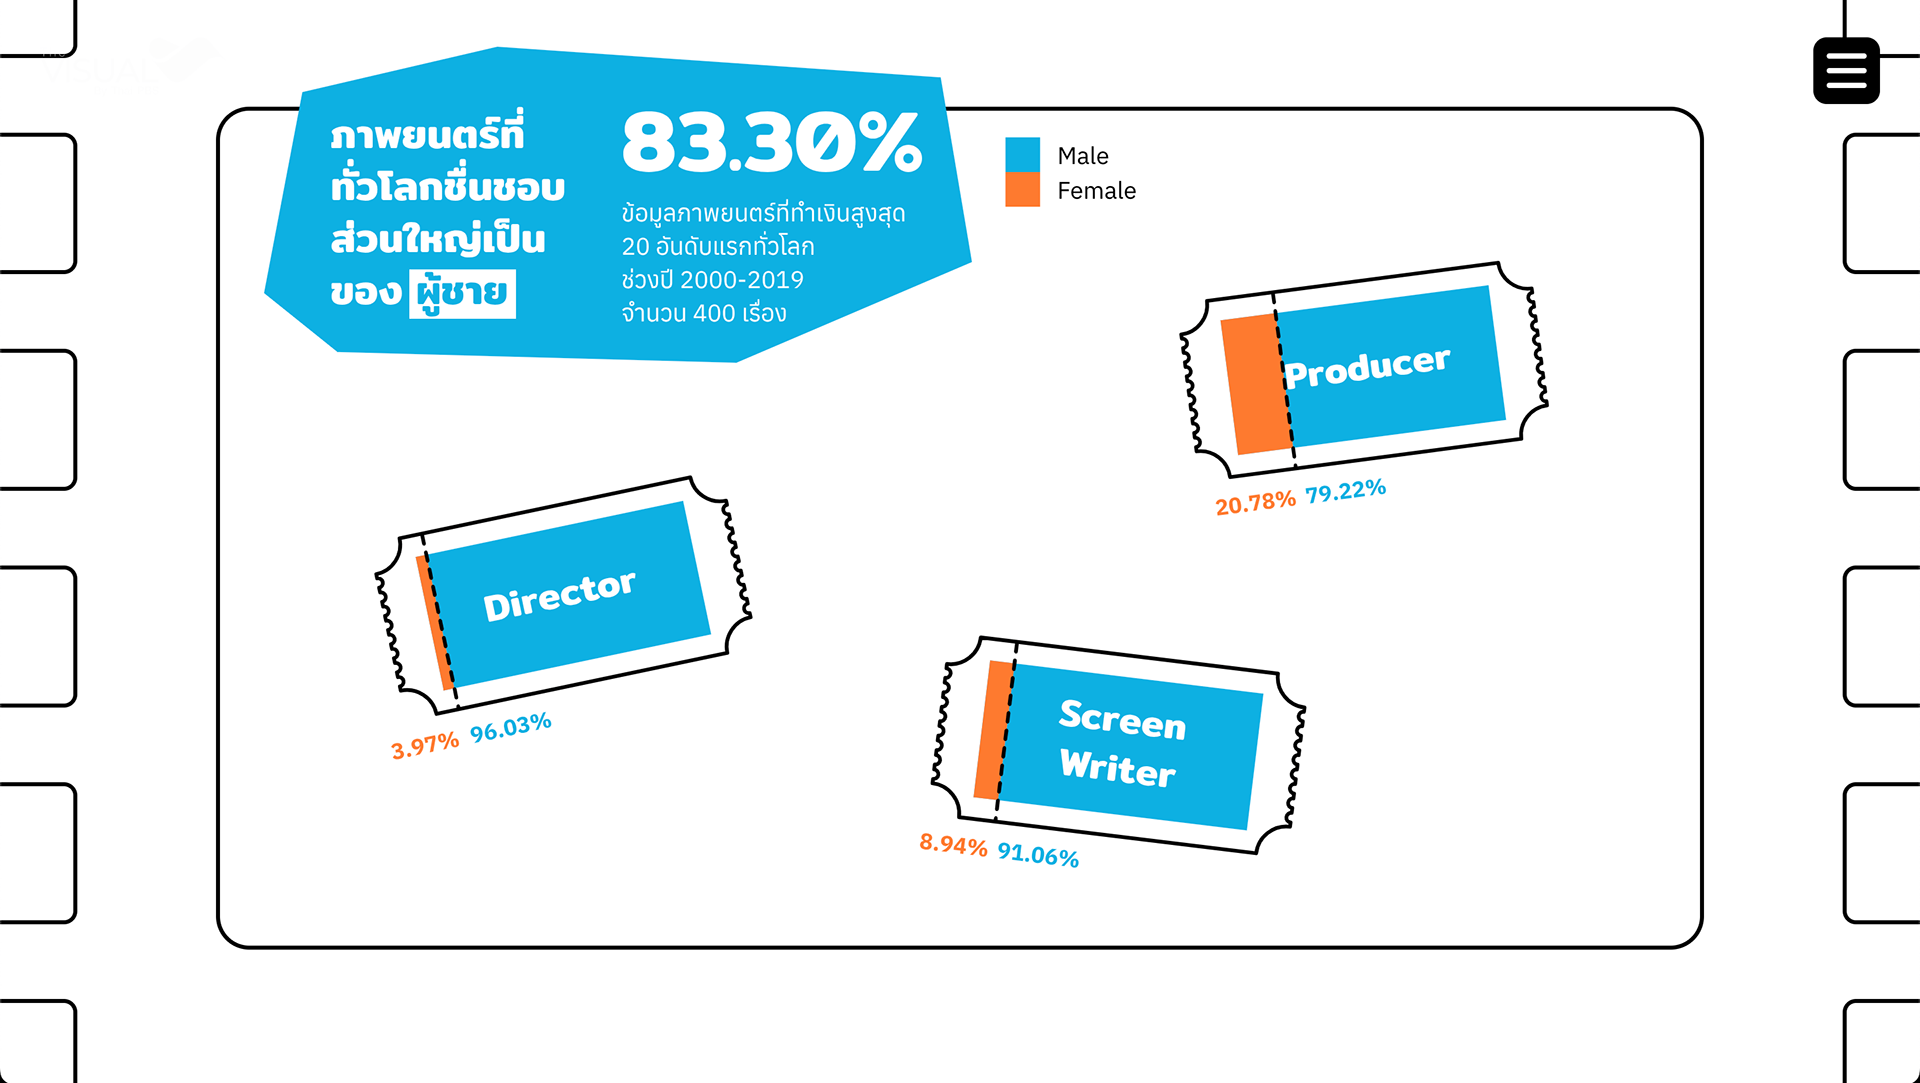
The 20 highest grossing films of all time 83.3% made by men

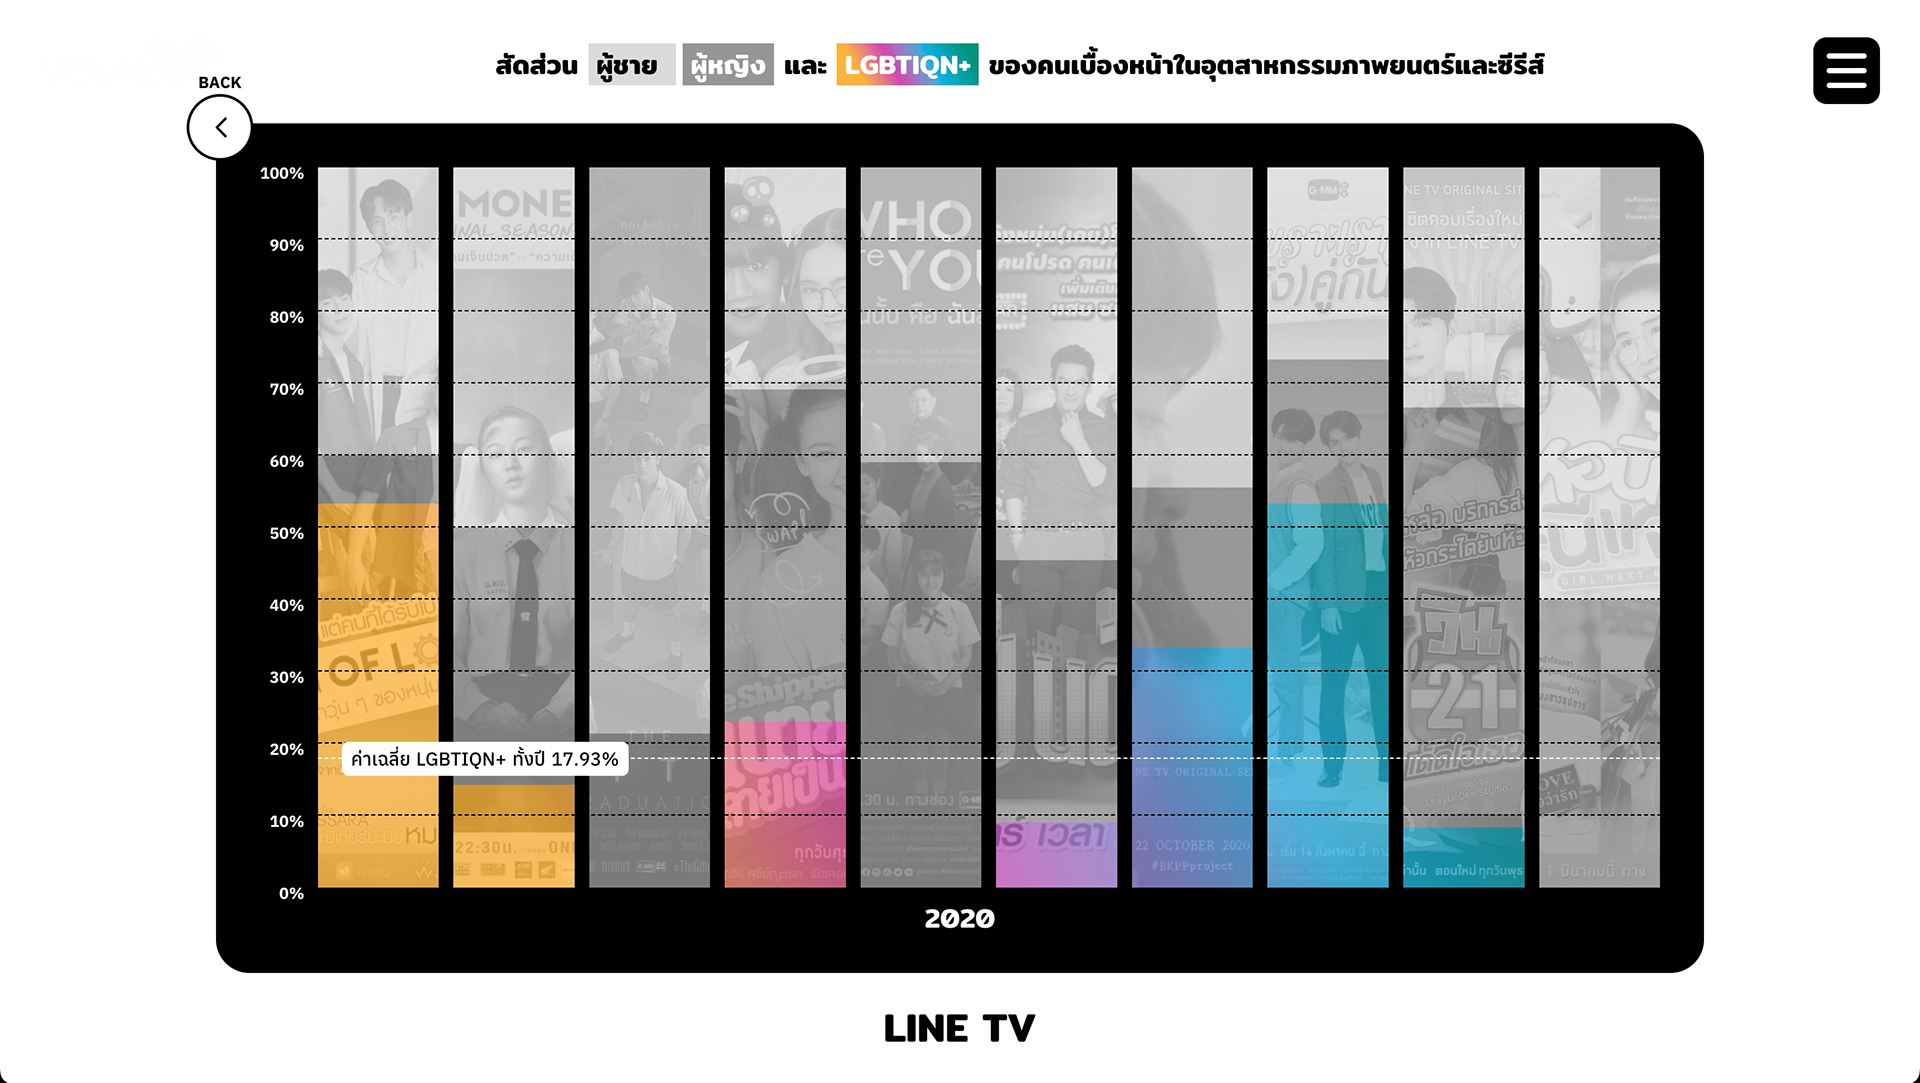
The percentage of men, women and LGBT+ on screen in LINE TV in 2020

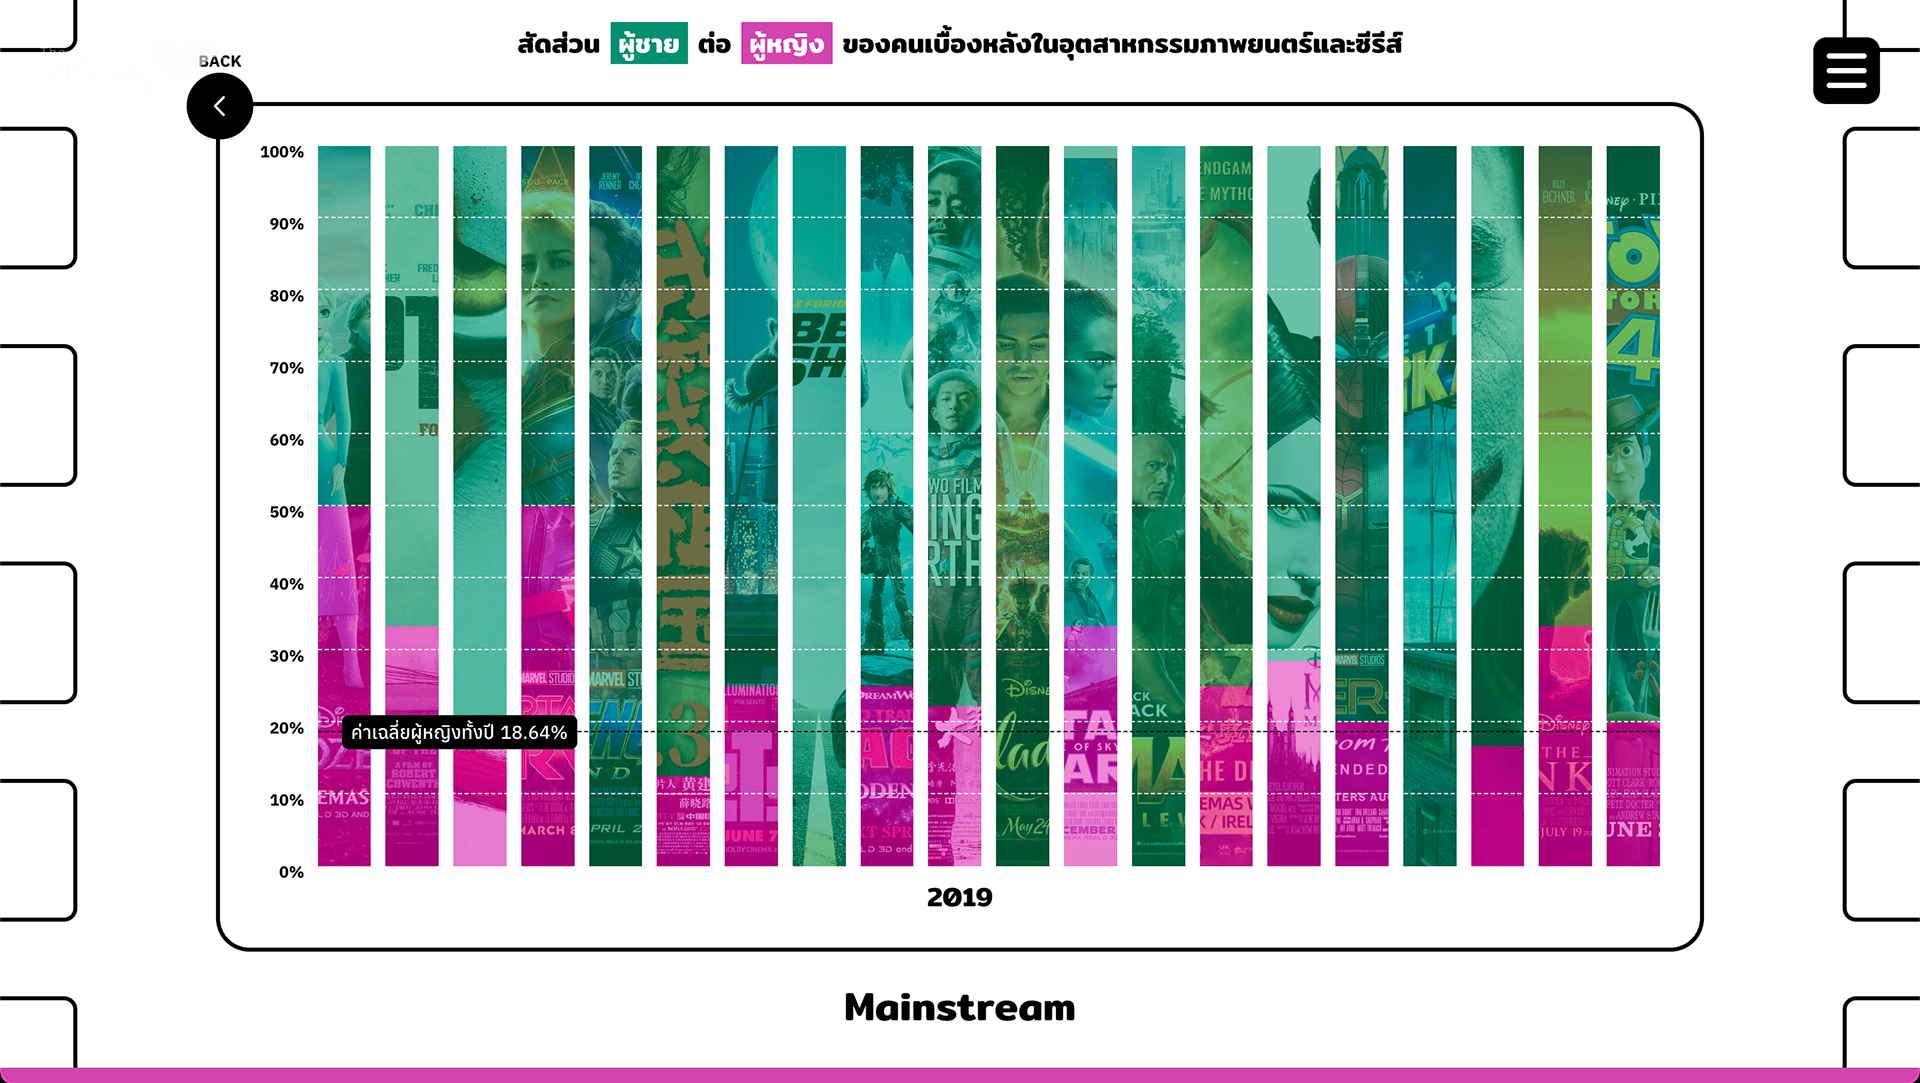
The percentage between men and women in entertainment production industry.
